10 Expense Categories Everyone Needs in Their Budget
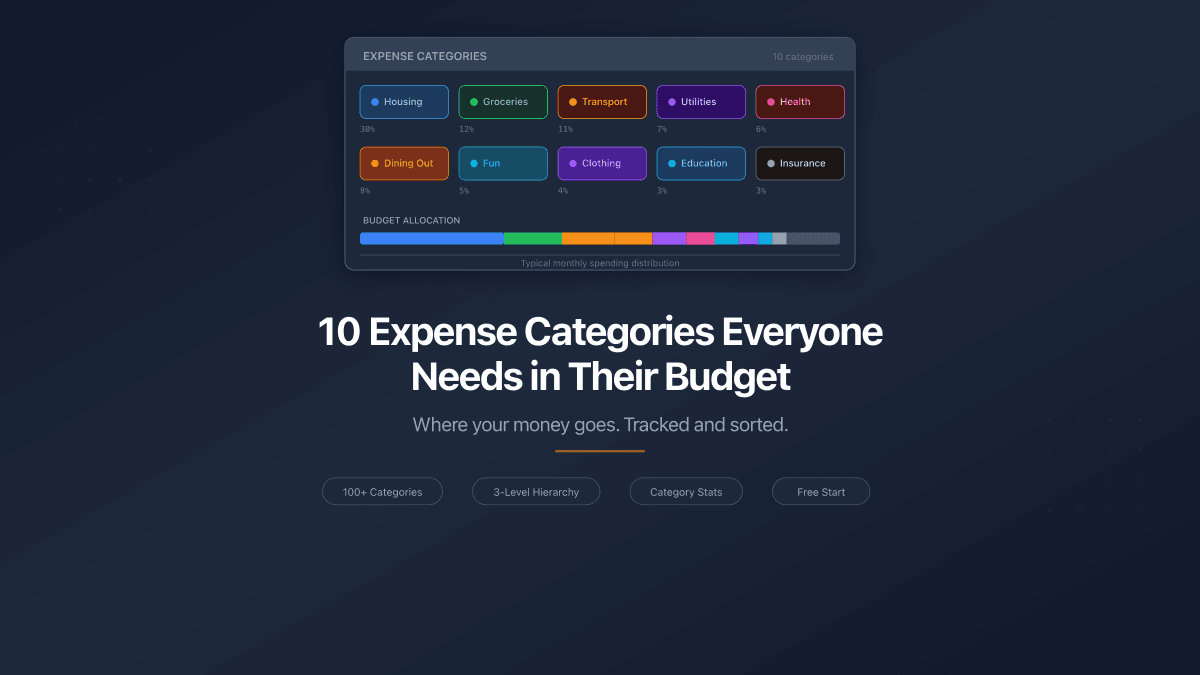
A budget without categories is a list of numbers. You see $4,200 in total spending and have no idea whether that is good, bad, or fixable. Categories turn raw transactions into answers: 32% on housing, 14% on food, 8% on subscriptions you forgot you had.
The problem is not too few categories - it is too many. Start with 47 subcategories and you spend more time classifying purchases than understanding them. Start with the right ten and you cover roughly 95% of every dollar that leaves your account.
These ten categories work regardless of income level, country, or budgeting method. Whether you follow the 50/30/20 rule or build your own system from a complete budgeting guide, you need the same foundation.
1. Housing
Typical budget share: 25-35%
Housing is almost always the largest single expense. Rent or mortgage payments, property taxes, home insurance, and basic repairs all belong here.
What counts: rent, mortgage principal and interest, property tax, homeowner's or renter's insurance, HOA fees, essential repairs (leaking roof, broken heater).
What does not count: furniture, decorative upgrades, smart home gadgets. Those are wants, not housing costs.
One way to reduce it: Negotiate rent before renewal. Landlords prefer keeping a reliable tenant over finding a new one. A simple email asking for a rate freeze or modest reduction works more often than people expect - especially if you can point to comparable listings nearby.
2. Groceries
Typical budget share: 10-15%
Groceries cover food you prepare at home. Restaurants and takeout belong in a separate category - mixing them hides how much convenience eating costs.
What counts: supermarket purchases, farmers market produce, bulk warehouse runs, cooking ingredients, household cleaning supplies.
One way to reduce it: Plan meals for the week before shopping. A grocery list built from a meal plan eliminates impulse buys and cuts food waste. Studies consistently show that meal planning reduces grocery spending by 20-25%.
Track groceries separately from dining out. Most people underestimate restaurant spending by 30-40% because they mentally file it under "food" alongside groceries. Splitting these categories reveals the true cost of convenience.
3. Transportation
Typical budget share: 10-15%
Everything that moves you from point A to point B. This category splits naturally into ownership costs (fixed) and operating costs (variable).
What counts: car payment or lease, auto insurance, fuel, parking, tolls, public transit passes, ride-sharing, vehicle maintenance and repairs, registration fees.
One way to reduce it: Track fuel spending for one month. Most drivers have no idea what they spend on gas. Once you see the number, carpooling one or two days a week or batching errands into fewer trips becomes a clear savings lever.
4. Utilities and Bills
Typical budget share: 5-10%
Monthly services that keep your home functional. These are predictable, recurring costs - perfect candidates for autopay.
What counts: electricity, gas, water, sewer, trash collection, internet, mobile phone plan.
What does not count: streaming services (those are entertainment), premium phone upgrades (wants).
One way to reduce it: Call your internet provider once a year and ask for current promotional rates. Existing customers often pay 20-40% more than new subscribers for the same speed. A ten-minute call can save $20-40 per month.
5. Healthcare
Typical budget share: 5-8%
Medical costs swing wildly between months, which makes them hard to budget. The fix: average your annual healthcare spending and set aside that amount monthly.
What counts: health insurance premiums, doctor copays, prescriptions, dental cleanings, vision care, therapy sessions, over-the-counter medications.
One way to reduce it: Use generic medications whenever possible. The FDA requires generics to be chemically identical to brand-name drugs. The price difference averages 80-85%.
6. Dining Out
Typical budget share: 5-10%
Restaurants, cafes, coffee shops, food delivery, work lunches, and drinks with friends. This category is the single biggest budget leak for most people under 40.
What counts: restaurant meals, coffee shops, takeout, food delivery apps, bar tabs, work lunches bought rather than packed.
One way to reduce it: Set a weekly dining budget instead of monthly. "$200 per month" feels abstract. "$50 per week" creates a visible countdown that changes behavior. When you have $12 left on Thursday, you pack lunch on Friday.
Delivery app fees add 15-30% on top of restaurant prices. A $15 meal becomes $19-22 after delivery fee, service fee, and tip. Tracking delivery separately (or at least noting it) reveals this hidden markup.
7. Entertainment and Leisure
Typical budget share: 3-8%
Fun money. Movies, concerts, games, hobbies, sports, streaming services, books. This is the category where guilt lives - and should not.
What counts: streaming subscriptions (Netflix, Spotify, YouTube Premium), movies, concerts, sporting events, hobbies and equipment, books, video games, gym membership.
One way to reduce it: Audit your subscriptions quarterly. The average person pays for 3-4 services they rarely use. Cancel, re-subscribe later if you miss it. Most services offer return discounts.
8. Clothing and Personal Care
Typical budget share: 3-5%
Clothes, shoes, haircuts, skincare, cosmetics. The distinction between need and want matters here: replacing worn-out work shoes is a need, buying a third pair of sneakers is a want.
What counts: clothing, shoes, dry cleaning, haircuts, personal hygiene products, skincare, cosmetics.
One way to reduce it: Apply the one-in-one-out rule. Buy a new shirt, donate or sell an old one. This curbs accumulation and forces you to evaluate whether the purchase is worth displacing something you already own.
9. Education and Self-Development
Typical budget share: 1-5%
Courses, certifications, books, conferences, tutoring. An often-overlooked category that people either overspend on (buying courses they never finish) or underspend on (avoiding paid resources when free alternatives are worse).
What counts: online courses, university tuition, professional certifications, books and audiobooks, conferences, tutoring, language learning apps.
One way to reduce it: Finish what you have before buying more. Most people own three to five unfinished courses. Complete one before purchasing the next. This simple rule prevents course-hoarding - a pattern that costs hundreds annually and produces nothing.
10. Insurance and Financial Fees
Typical budget share: 2-5%
Premiums, bank fees, and financial service costs. Health insurance goes under Healthcare. This category captures everything else - life insurance, car insurance deductibles, bank maintenance fees, investment platform costs.
What counts: life insurance, disability insurance, umbrella policies, bank account fees, ATM fees, investment management fees, credit card annual fees.
One way to reduce it: Switch to a no-fee bank account. Monthly maintenance fees of $10-15 cost $120-180 per year for a service that many banks offer free. Same for ATM fees - using out-of-network ATMs twice a week at $3 each adds up to $300 per year.
Three Categories You Do Not Expect
The ten core categories cover daily life. Three sneaky categories cover the spending that falls through the cracks:
Gifts and celebrations. Birthdays, holidays, weddings, baby showers. Most people budget zero for gifts and then spend $500-1,500 per year on them. Create a gifts category, estimate your annual total, and divide by twelve.
Impulse purchases. The random Amazon order. The gas station snack. The "I deserve this" purchase after a hard week. Tracking these separately - even for one month - reveals patterns. Most people discover $50-150 per month in spending they cannot recall making.
Bank fees and interest. Late payment fees, overdraft charges, credit card interest. These are not purchases - they are penalties for disorganization. Tracking them creates urgency to automate payments and eliminate the fees entirely.
If your "Other" or "Miscellaneous" category consistently exceeds 5% of total spending, it is too broad. Break it into specific subcategories. "Other" should be a temporary bucket for transactions you have not classified yet, not a permanent home for 10% of your income.
How Categories Work in PaperLink
This article covers ten categories. PaperLink ships with all ten - and far more. The default category tree includes 29 top-level expense groups with over 500 subcategories across three levels. Housing alone breaks into seven subcategories: Rent, Mortgage, Property Tax, Home Insurance, Home Maintenance, Home Office, and Other Housing - each with its own children (Monthly Rent, Security Deposit, Plumbing, HVAC, and so on). Transportation splits into Vehicle Ownership, Vehicle Operating, Parking and Tolls, and Public Transit. Food separates Groceries, Dining Out, Food Delivery, Workplace Food, and Beverages.
The ten categories in this article map directly to top-level groups already in your workspace. You do not need to create them - they exist from the moment you sign up.
Customization is built in. Rename categories to match your vocabulary. Add subcategories for spending you want to track more precisely. Archive categories you do not use - they disappear from your dropdown but their historical data stays intact.
Autocomplete learns your patterns. After a few entries, typing "Star" auto-fills "Starbucks" with the amount, account, and category pre-filled from your last visit. Recurring expenses become two keystrokes and a confirmation.
Analytics by category show where each dollar goes. Filter by date range, account, or category to see monthly trends, compare periods, and identify the spending patterns that matter most.
For a full overview of the tracking features - including eight account types, multi-currency support, and transfers between wallets - read our free expense tracker guide.
FAQ
How many categories should I start with?
Start with these ten. Add subcategories only when a top-level category is too broad to be useful. "Food" might need splitting into Groceries and Dining Out. "Transportation" might not need splitting at all if you only use public transit.
Should I track every single purchase?
Yes, for the first month. After that, decide which granularity matters to you. Some people track every coffee. Others round to the nearest dollar and categorize weekly. The first month of complete tracking reveals your real spending pattern - something no amount of estimation can replace.
What is the best way to handle shared expenses?
Create categories that match how you split costs. If you share rent with a roommate, log your half under Housing. If you take turns paying for groceries, log every purchase and settle the difference monthly. PaperLink supports personal and team workspaces - use team mode for household budgets where multiple people need visibility.
What about savings - is that a category?
Savings is a destination, not an expense category. Track transfers to savings accounts as transfers between accounts rather than categorizing them as spending. This keeps your expense totals accurate and your savings visible as a separate balance.
Start Tracking by Category
You do not need to build a system from scratch. Create a free account and start with pre-configured categories. Rename what you want, add what you need, and track your first week of spending in the categories that matter.
PaperLink goes beyond personal budgeting. Share business proposals, invoices, and presentations with built-in analytics - see who viewed your documents, which pages held their attention, and how long they spent reading. Explore document sharing analytics.
Related articles:
- How to Budget - A Complete Beginner's Guide - the full guide to budgeting methods, categories, and tools
- The 50/30/20 Budget Rule - how to split your paycheck into needs, wants, and savings
- Free Expense Tracker - PaperLink's built-in expense tracking features
- Freelancer Finance Guide - how to manage finances with irregular income
¿Listo para probar PaperLink?
Crea facturas, comparte documentos y gestiona tu negocio — todo en un solo lugar.
Publicaciones relacionadas
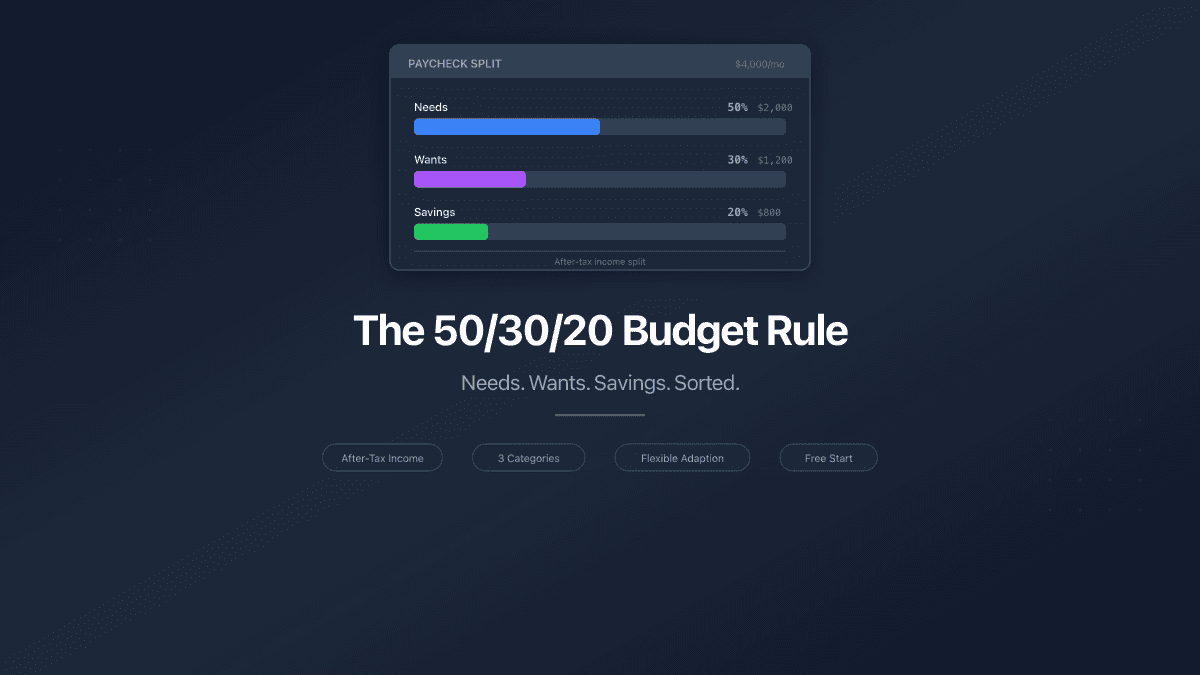
The 50/30/20 Budget Rule - How to Split Your Paycheck
The 50/30/20 budget rule splits after-tax income into needs, wants, and savings. Learn how to apply it, adapt it, and track your split.
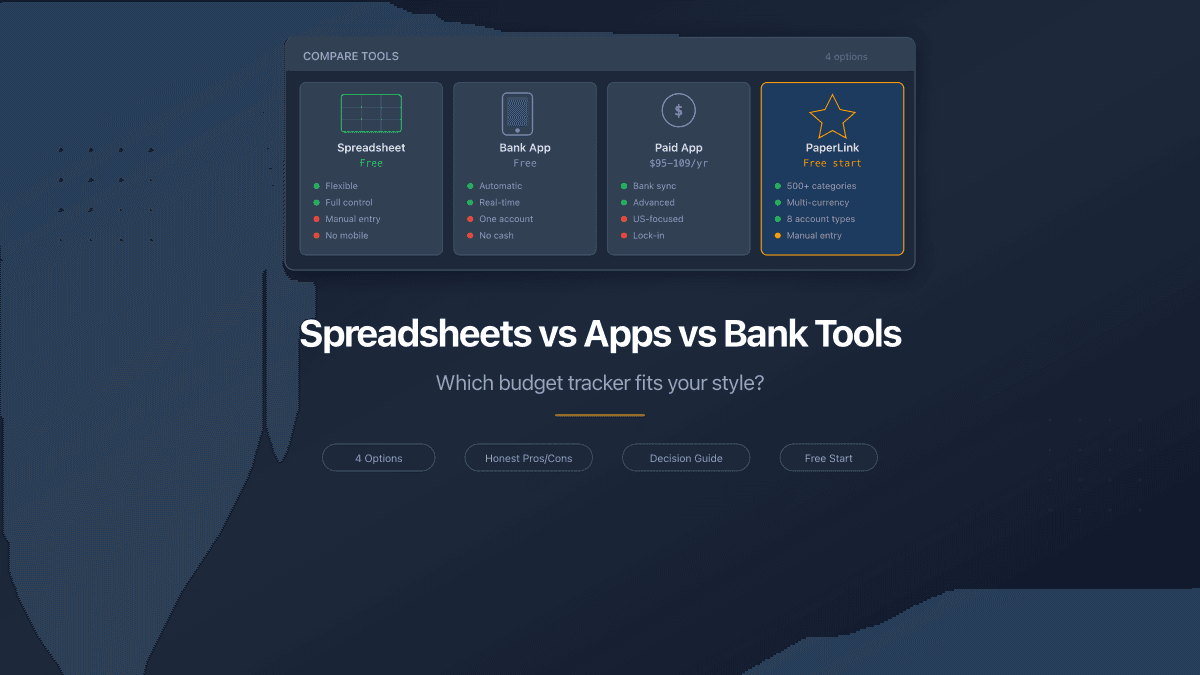
Spreadsheets vs Apps vs Bank Tools - Where to Track Money
Spreadsheets, bank apps, and dedicated budget tools compared honestly. Pros, cons, pricing, and which option fits your situation in 2026.
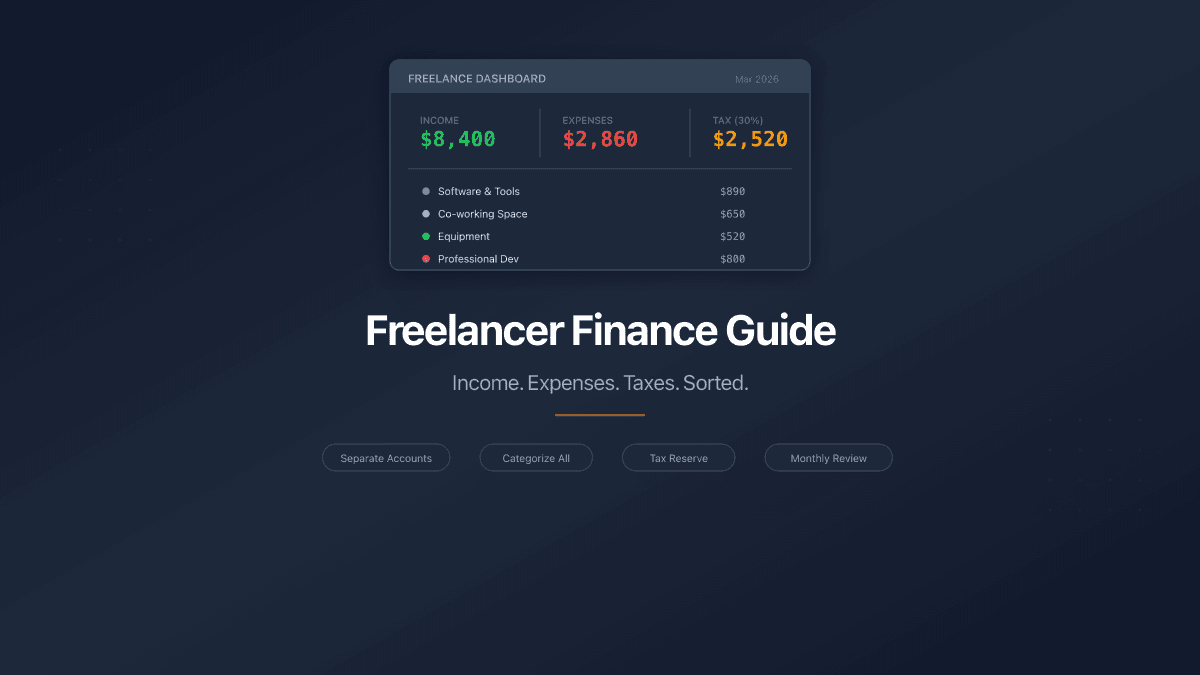
Freelancer Finance Guide - Track Income, Expenses, and Taxes
A practical guide to freelancer finances: separate accounts, categorize expenses, set aside 25-30% for taxes, and review monthly. Free tools included.